1
2
3
4
5
6
7
8
9
10
11
12
13
14
15
16
17
18
19
20
21
22
23
24
25
26
27
28
29
30
31
32
33
34
35
36
37
38
39
40
41
42
43
44
45
46
47
48
49
50
51
52
53
54
55
56
57
58
59
60
61
62
63
64
65
66
67
68
69
|
%matplotlib inline
import pymysql
import time
import matplotlib.pyplot as plt
def get_content_from_db(sql):
print('连接数据库!')
dbhost='localhost'
dbuser='root'
dbpass='123456'
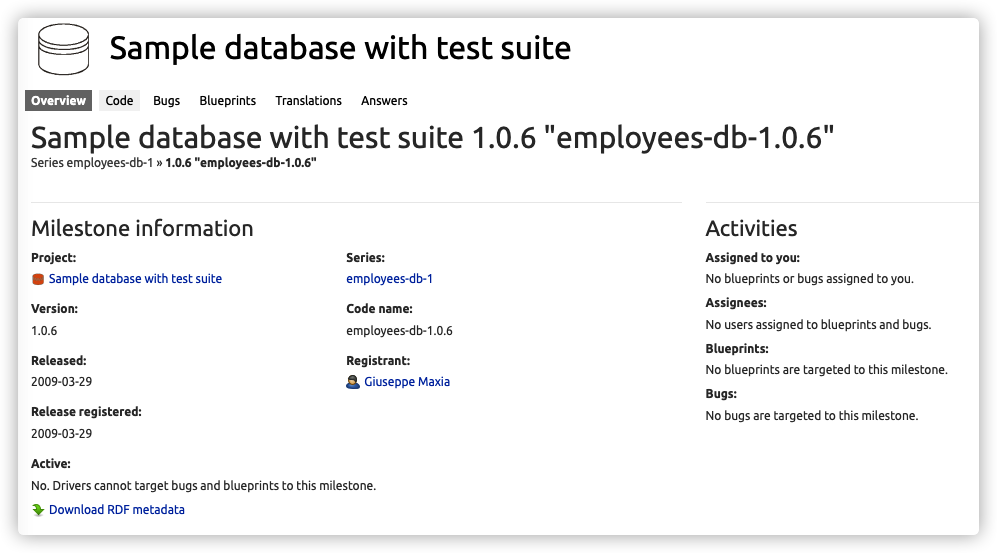
dbname='employees'
db = pymysql.connect(host=dbhost,user=dbuser,password=dbpass,database=dbname,charset = "utf8mb4")
try:
cursor = db.cursor()
cursor.execute(sql)
results = cursor.fetchall()
except:
print ('Reading Error ')
finally:
db.close()
print ('Completion of data reading ')
return (results)
def title_show(results,title,save_file_name):
indexList = []
itemList = []
for i in results:
indexList.append(i[1])
itemList.append(i[0])
plt.rcParams["font.family"] = 'Arial Unicode MS'
plt.rcParams['axes.unicode_minus'] = False
plt.figure(figsize=(10, 5), dpi=150)
explode = (0, 0, 0, 0, 0, 0, 0.1)
plt.pie(indexList, labels=itemList, autopct="%1.1f%%", explode=explode)
plt.title(title, fontsize=16)
plt.axis("equal")
plt.legend()
plt.savefig(save_file_name+'.png',facecolor='white',dpi= 200)
plt.show()
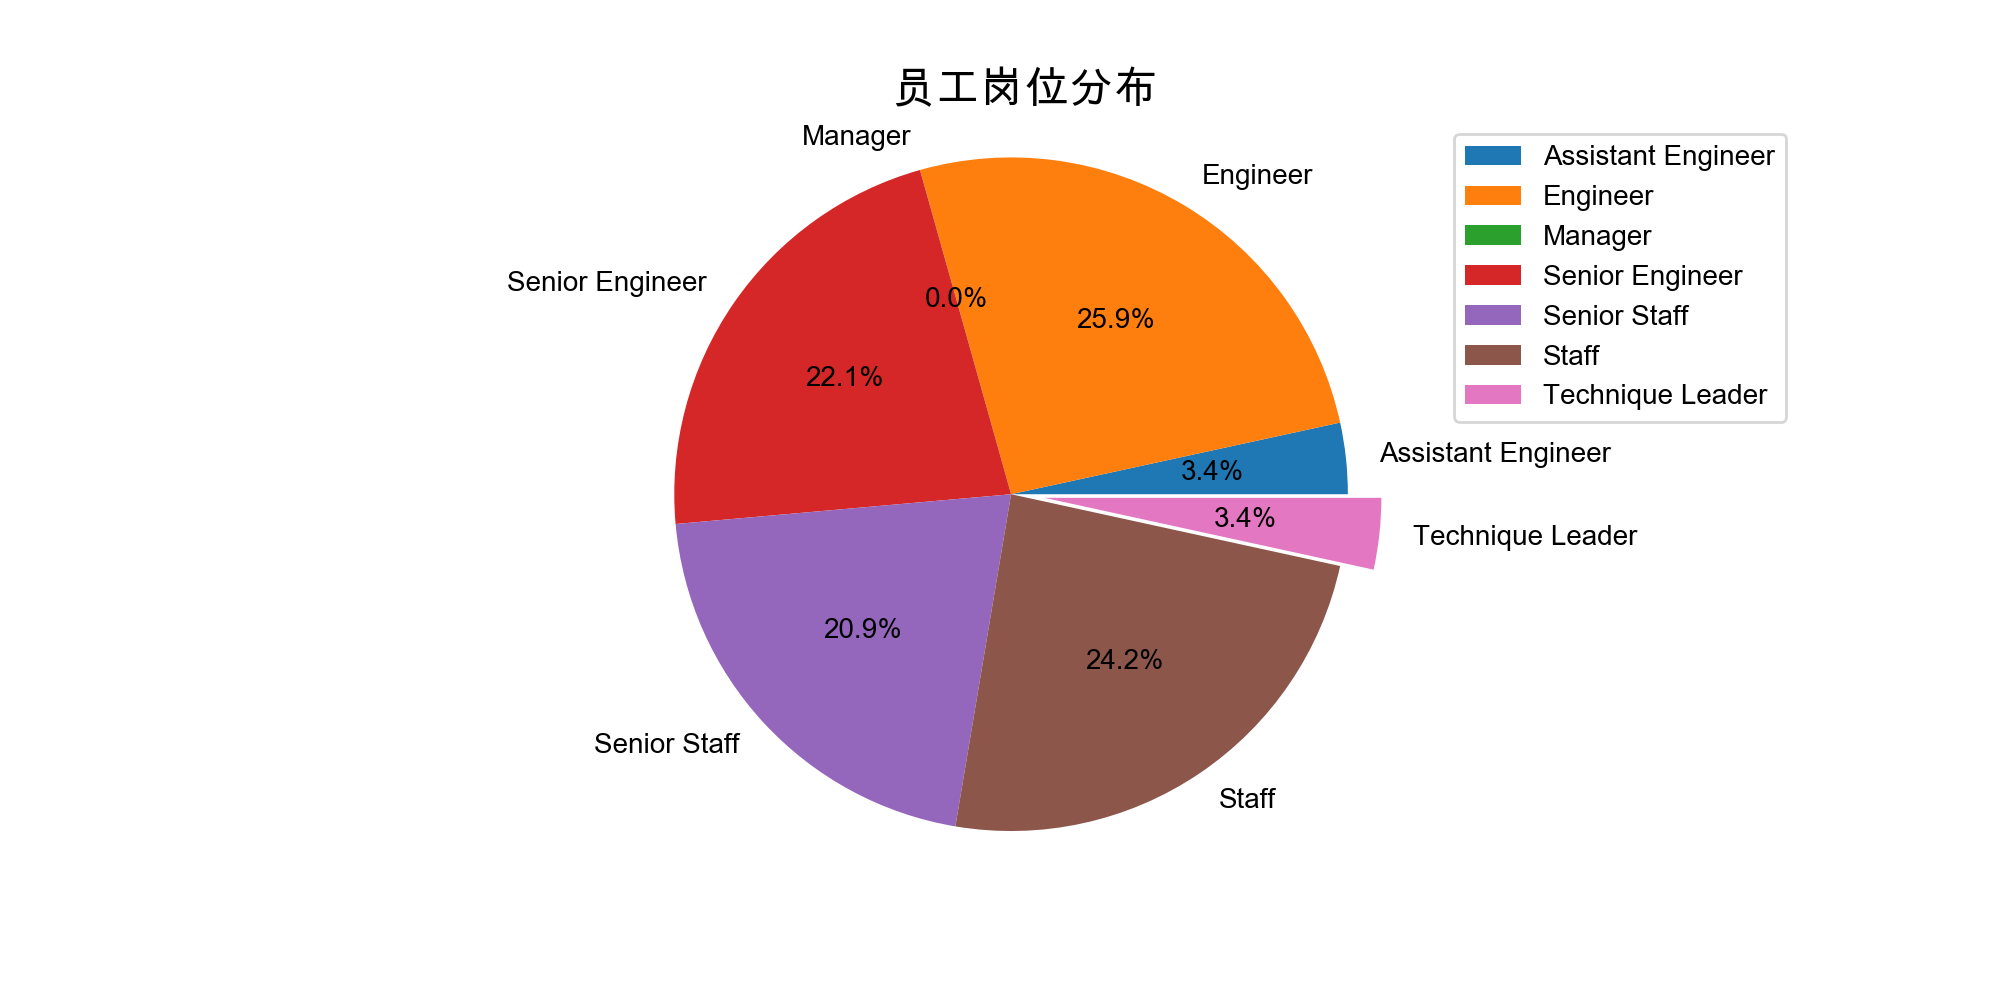
sql_1 = """SELECT title , COUNT(*) AS count FROM employees.titles GROUP BY title"""
results = get_content_from_db(sql_1)
title_show(results,"员工岗位分布",'title')
sql_2 = """
SELECT ELT(INTERVAL(salary, 30000, 50000, 70000, 90000, 110000, 130000, 150000),
'<30000', '30000-50000', '50000-70000', '70000-90000', '90000-110000', '110000-130000', '>=150000')
AS salary_level, count(*) AS count FROM employees.salaries GROUP BY salary_level
"""
results = get_content_from_db(sql_2)
title_show(results,"员工工资分布",'salaries')
|